Cinética química detalhada de etanol


Thermal Oxidation of Ethanol: Experimental and Numerical Analysis of Ignition Chemistry of Ethanol-Air Mixtures in Shock-Heated Gases
Leonel Rincon Cancino, Dr. Eng.
Amir Antônio Martins Oliveira, Ph.D.
Combustion and Thermal Systems Engineering Laboratory – LABCET
Mechanical Engineering Department
Federal University of Santa Catarina
Brazil.
Mustapha Fikri, Dr.
Christof Schulz, Dr.
Institute for Combustion and Gasdynamics – IVG
University of Duisburg-Essen
Germany
Contact: Prof. L.R.Cancino – leonel.cancino@labmci.ufsc.br
Abstract: The present work proposes a detailed kinetic model for the thermal oxidation of ethanol/air mixtures at intermediate temperatures and high pressures, validated against ignition delay times measured in a shock tube behind reflected shock waves. Ignition delay times (τ) were measured under stoichiometric conditions at 10, 30, and 50 bar and from 650 to 1220 K. From a multiple linear regression analysis using ln(τ) as the dependent variable and (1/T) and ln(p) as independent variables an expression of τ/s = 10-1.79 exp(+12400 K/T )(p/bar)-0.83 was curve fitted for the measured range of temperature, pressure and stoichiometric mixture. The kinetics model was built up by incorporating available submechanisms for ethanol chemistry (Marinov) as well as C3-chemistry (Konnov), taken as central kernel. Additionally, other key reactions obtained from computational chemistry and available on the literature (Lin) were included. For improvement of the model, the sensitivity of each reaction on temperature, OH, H2O2, and C2H5OH concentrations was determined using a perfectly-stirred-reactor assumption for temperatures of 1100, 950, and 800 K at all pressures and stoichiometric mixture. The sensitivity analysis identified a set of important reactions involving the H-atom abstraction from the ethanol molecule by the hydroperoxy radical (HO2), giving CH3CHOH, acetaldehyde and H2O2. The model predicts the global trend with temperature and pressure as well as the lower sensitivity of the ignition delay time with pressure at higher pressures.
1. Introduction
There are several motivations to investigate and learn about the combustion of ethanol. In summary, there is a need of a) alternatives to conventional hydrocarbon fuels, especially from renewable sources, b) reduction of pollutant and carbon emissions from energy and power, and c) additives to control engine knock (Curran et al. (1992)). These needs are grounded on economic and environmental considerations. In the last sixty years, several authors have focused on ethanol oxidation. As results of these efforts a limited quantity of experimental and numerical investigations about ethanol kinetics involving different experimental setup and numerical models is available. From the pioneering works, using a well-stirred reaction vessel, Barnard and Hughes. (1960) showed that the pyrolysis of ethanol at temperatures between 849 and 897 K can be described as a homogeneous reaction of first order. Gulder. (1982) measured laminar burning speed of ethanol-air in lean and rich mixtures in a constant pressure bomb at pressure of 1 bar and room temperature. More recently, Borizov et al. (1991) used a reaction vessel to experimentally analyze the pyrolysis of ethanol at 1 bar and a temperature range of 700 – 1700 K. These results where later complemented by detailed laminar flame and shock tube data. Egolfopoulos et al. (1992) measured laminar burning speed, ignition delay time and chemical species in ethanol/(air/O2) mixtures by using a shock tube, a counterflow twin flame and a flow reactor.
Kohse-Höinghaus et al. (2007) reported chemical species measurements and flame structure of ethanol/O2 mixtures at 298 K and low pressures (0.05 bar). Natarajan and Bhaskaram (1981) reported ignition delay time measurements in a shock tube for pressures of 1.0 and 2.0 bar and high temperatures. Borizov et al. (1989) measured ignition delay times in ethanol/O2 mixtures by using the shock tube at pressures between 0.5 and 6 bar. Dunphy and Simmie (1991) measured ignition delay times in a shock tube of ethanol/O2 mixtures at high temperatures and pressures of 1.8 to 4.6 bar. Curran et al. (1992) measured ignition delay times of ethanol/O2 mixtures in a shock tube at high temperatures and a pressure of 2.3 bar for lean and rich mixtures. Li et al. (2007) report measurements of stable species in the ethanol oxidation in a variable pressure flow reactor. The measured species were C2H5OH, H2O, C2H4, CH4, CH3CHO, CO and CO2, at pressure range of 3 to 12 bar, initial temperatures from 800 to 950 K and equivalence ratio from 0.3 to 1.4. Recently, the available data was extended to higher pressure.
Cancino et al. (2007) reported measurements of ignition delay times in a high pressure shock tube from 690 to 1200 K and pressure of 30 bar. To the author’s knowledge,these are the highest pressures reported so far for ethanol oxidation. Detailed chemical kinetic mechanisms have also been developed using these experimental results as guidance. Natarajan and Bhaskaram (1981) reported a detailed kinetic model for the high-temperature oxidation of ethanol containing 56 elementary reactions, including the bimolecular decomposition reaction C2H5OH + M ⇄ CH2OH + CH3 + M, in other words, proposing the C-C cleavage of ethanol. Validation against experimental data of ignition delay time in a shock tube at pressures of 1.0 and 2.0 bar and temperatures between 1300 and 1700 K resulted in good agreement with the pressure dependence. Borizov et al. (1989) and Borizov et al. (1992) reported another detailed kinetic model for the high-temperature ignition of ethanol involving 94 elementary reactions. This kinetic mechanism was built starting from the Natarajan and Bhaskaram (1981) model, adding reactions that describe the pyrolysis of ethanol and some reactions representing the thermal oxidation by active radicals, not considered in the Natarajan model.
The model was validated against experimental results of ignition delay time in shock tubes for stoichiometric, lean and rich compositions at pressure of 1 atm and a good agreement was found. In the nineties, Marinov (1999) developed a comprehensive model composed by 383 elementary reactions among 57 chemical species for the high-temperature ethanol oxidation. It included an accurate kinetics data-set for ethanol oxidation, reaction routes involving H-abstraction, C-C and C-O cleavage were proposed and computational chemistry methods were used in order to determine the Arrhenius parameters. It was validated against experimental results of ignition delay time in shock tube, laminar flame speed in counterflow twin flame and chemical species concentrations in jet-stirred reactor. Good agreement was found in general with all measurements. More recently, Saxena and Williams (2007) reported a kinetics model with 288 elementary reactions among 57 chemical species. This model is about 100 elementary reactions smaller than Marinov’s and also predicts the nitrogen oxidation chemistry. It was validated against experimental results of ignition delay time in a shock tube at high temperatures (1300 to 1700 K) and pressures of 1.0 and 2.0 bar for stoichiometric, lean and rich ethanol/O2/Ar mixtures. The Saxena model was also validated against laminar burning velocity data from Egolfopoulos et al. (1992). Marinov’s and Saxena and William’s models were also tested by Li et al. (2007). They proposed an improved detailed kinetic model for pyrolysis and oxidation of ethanol based mostly on their previous work (see references in Li et al. (2007)). Their model consists of 39 chemical species and 238 reversible elementary reactions and was developed in a hierarchical manner. The final mechanism was validated against the experimental results of shock tube from Curran et al. (1992) and Natarajan and Bhaskaram (1981), laminar flame from Gulder. (1982) and Egolfopoulos et al. (1992) (from 300 to 450 K), and their own variable pressure flow reactor (temperature from 800 to 950 K, pressure from 3 to 12 bar and equivalence ratio from 0.3 to 1.4). An agreement better than previous models (Marinov (1999) and Saxena and Williams (2007)) was obtained. The comparison with shock tube ignition delay from 2 to 4.5 bar resulted in the same trend of reduction of ignition delay time as pressure increases. But, there was a tendency of overpredicting the ignition delay in the lower temperature range at higher pressure. Numerical studies on ethanol decomposition using computational chemistry have also been reported. They have been useful in completing the gaps on thermodynamic and chemical kinetic parameters as well as in pointing out important reactions and reactions with a very high reaction barrier. Marinov (1999) used RRKM theory to analyze the multichannel decomposition of ethanol. In this study, he determined the reaction rate parameters of the thermal decomposition of ethanol at high temperatures, involving new degradation routes like H-abstraction. These new data permitted to increase the accuracy of the kinetic modeling resulting in a good comparison to a host of experimental data. Recently, Li et al. (2004) found that Marinov’s model underestimates the production rate of H2O and C2H4 as well as the overall ethanol consumption. He then presented a new set of Arrhenius parameters for the decomposition reactions; C2H5OH ⇄ C2H4 + H2O and C2H5OH ⇄ CH3 + CH2OH. Finally, Lin et al. (2002), Lin et al. (2003) and Lin et al. (2004) published the most recent kinetic data obtained from computational chemistry for the thermal oxidation of ethanol. They provided a new kinetic database allowing for thermal decomposition of ethanol and ethanol-radical reactions. High barrier reactions are detected and critical reactions are identified.
This work has two objectives: (1) to report experimental results of shock tube experiments at high pressures and intermediate temperatures for ethanol, which have not been covered in the literature so far, and (2) to propose a detailed kinetics model for the ethanol oxidation obtained by using and improving available kinetics models.
2. Chemical reaction pathways for thermal oxidation of ethanol
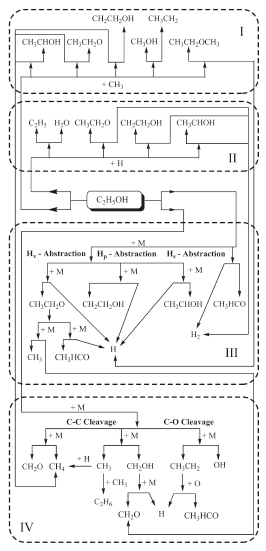
The oxidation of hydrocarbons proceeds either by hydrogen atom abstraction or by cleavage of C-C bonds at primary or secondary carbon atoms. In the case of aliphatic alcohol hydrocarbons, the hydroxyl group plays a very important role for the oxidation and as a third pathway the cleavage of the C-O bond can occur. Any of the three paths follows after a temperature activated perturbation of the energy field of the molecule and proceed either by intramolecular (isomerization), giving several sub-structures, or as a result of collision with active radical species. Several authors have qualitatively described the decomposition of ethanol. Recently, Lin et al. (2002), Lin et al. (2003) and Lin et al. (2004) reported 11 different routes for ethanol decomposition involving reactive radical species. Figure 1 summarizes these major routes.
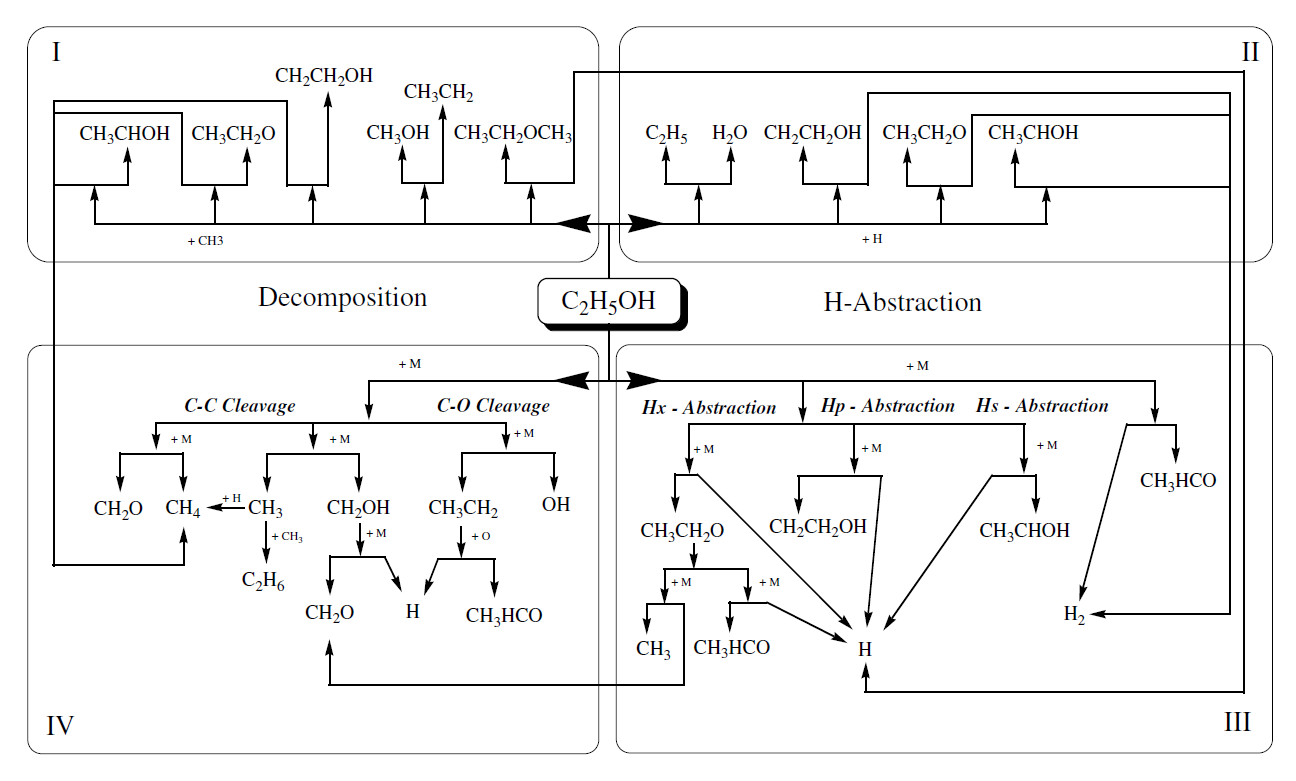
Figure 1. Ethanol decomposition pathways
Box I shows the decomposition routes involving methyl giving methane and hydrogen atoms as a product in three routes. Box II depicts H abstraction involving H atoms and producing molecular hydrogen via three routes and additional other unstable species.
Box III depicts the H abstraction by a unimolecular self-cleavage process; all routes giving acetaldehyde, molecular and atomic hydrogen. Box IV shows the decomposition process by unimolecular self-cleavage, involving the C-C and C-O bonds and the products are formaldehyde, methane and other unstable species. One can clearly see that the pyrolysis of ethanol proceeds by a chain-branching mechanism where free radical species like methyl and H atoms produced in boxes III and IV feed the active radical species for pathways of boxes I and II. Kinetics models of ignition of ethanol/O2, Borizov et al. (1992) and ethanol/air, Cancino and Oliveira (2006), Gardiner (2000) show that during the induction period ethanol is consumed almost completely. The depletion of the fuel is induced by oxidative pyrolysis. Therefore, the ethanol oxidation model capable of describing accumulation of the products during the induction period and the promoter effect on the ignition process must be based on an ethanol pyrolysis mechanism, such as the one described above. Since the pathways depicted in Figure 1 proceed at different rates depending on the range of temperature and pressure, a careful analysis and comparison to critical experiments may be able to reveal the most important routes at different pressure and temperature regimes. Excluding a single result at 30 bar, the low temperature data has been measured up to 4.5 bar and high temperature data has been measured up to 12 bar. Using the available chemical mechanisms, it has been observed that the predictions overestimate the shock tube ignition delay data at higher pressures. Therefore, questions remain whether the patterns discussed above are still correct for higher pressures and also how the rates of the different paths behave as pressure is increased. In the following, new measurements of ignition delay are presented and compared to an improved detailed chemical kinetic model.
3. Experiments
3.1. Experimental set-up
The experiments were carried out in the high-pressure shock tube at the University of Duisburg-Essen. This facility, depicted in Figure 2, has an internal diameter of 90 mm, divided by an aluminum diaphragm into a driver section of 6.1 m and a driven section of 6.4 m in length. The driven section is pumped down to pressures below 10-2 mbar in between the experiments. Gas mixtures were prepared by injecting liquid ethanol into a stainless-steel mixing vessel and subsequent complete evaporation and mixing. The total amount of fuel and air was controlled manometrically in order to ensure the desired equivalence ratio. The shock tube was heated to 348 K.
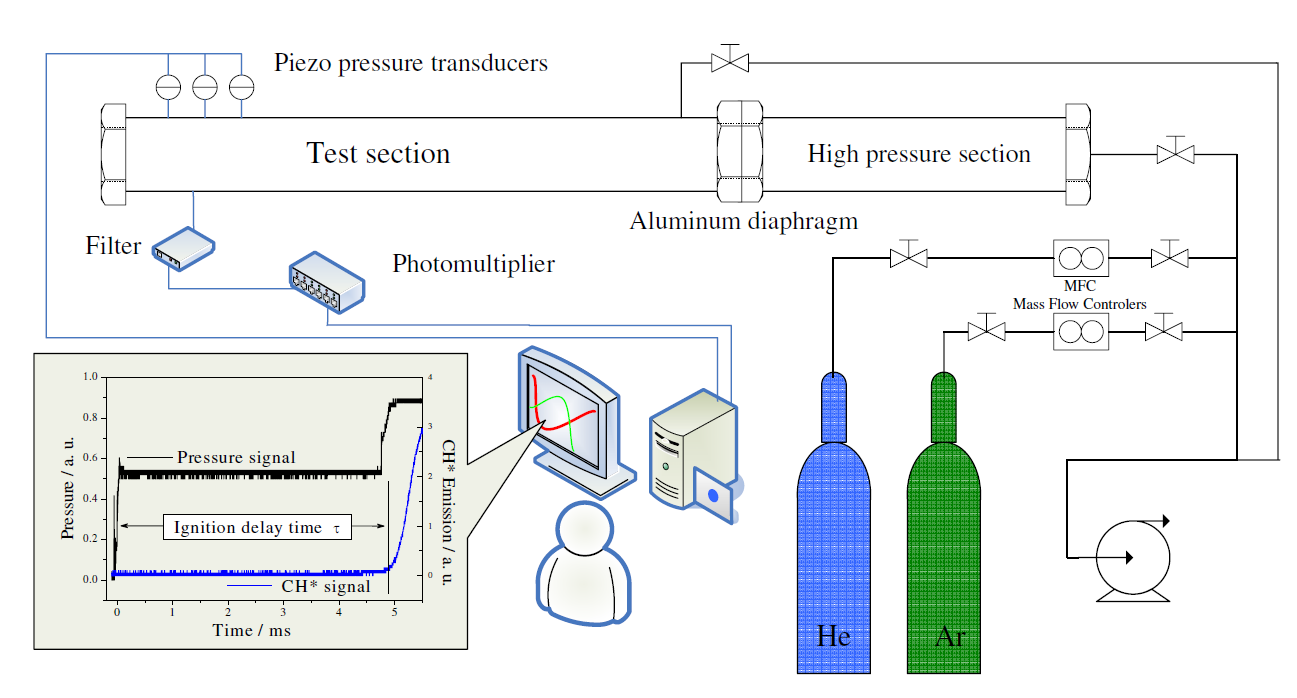
Figure 2. Experimental setup of the high-pressure shock tube facility
The shock speed was measured over two intervals using three piezo-electric pressure gauges. Pressure data were recorded with a time resolution of 0.1 μs. The temperature and pressure behind the reflected shock wave were computed from the measured incident shock speed and the speed attenuation using a one-dimensional shock-tube model (shock-tube code of the CHEMKIN package Kee et al. (2000)). The estimated uncertainty in reflected shock temperature is less than 25 K. The experiments were carried out with synthetic air containing 79.5% N2 and 20.5% O2. The ignition was observed by side-wall measurement of pressure profiles with a piezo-electric gauge (PCB HM 112 A03) located 15 mm upstream of the end flange. Also, the CH* emission at 431.5 nm from a side wall was selected by a narrow band pass filter (5 nm HWHM) and detected with a photomultiplier. All ignition delay times shown in this work were determined by extrapolating the steepest increase of the CH* chemiluminescence emission signal to its zero level on the time axis. The driver gas was mixed in-situ by using two high-pressure massflow controllers (Bronkhorst Hi-Tec flow meter F-136AI-FZD-55-V and F-123MI-FZD-55-V). Helium was used as the main component and Argon was added to match the acoustic impedance of the test gas. The required driver gas composition was calculated by a spreadsheet analysis prior to the experiments using equations by Oertel (1996) and Palmer and Knox. (1961). Concentrations of 5 to 20% Ar in He were required to generate tailored shock waves.
3.2. Measured ignition delay times
The ignition delay times evaluated from the CH* emission are listed in Table 1 along with the respective pressures p and temperatures T, for stoichiometric ethanol-air mixture. At temperatures lower than those shown in Table 1 no ignition was observed within the test time of our experiment (15 ms).
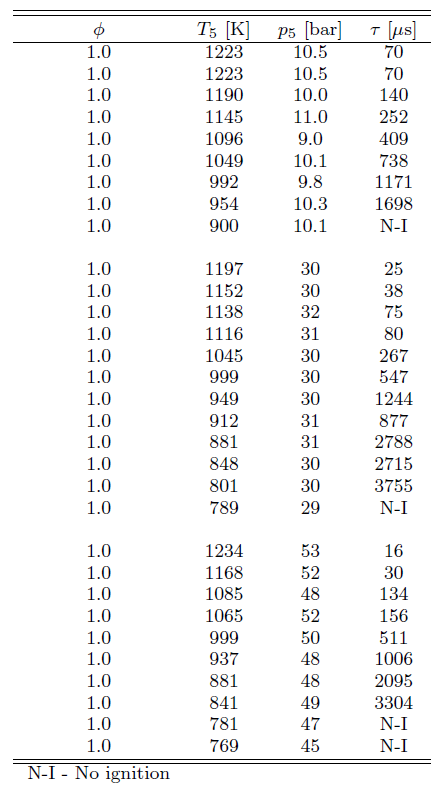
Table 1. Measured ignition delay times in shock tube for stoichiometric ethanol-air mixture
Figure 3 shows the experimental results for ignition delay time as a function of temperature (as an Arrhenius plot) for different pressures and stoichiometric composition. All data was curve-fitted to an equation of the form τ = A exp( B / T ) p–x, where x is the pressure exponent. Multiple linear regression analyses using ln(τ) as the dependent variable and (1/T) and ln(p) as independent variables identified an expression of τ = 10-1.79 exp(+12400 / T ) p-0.83, with T in K, p in bar and τ in μs, for the measured range of temperature and for a stoichiometric mixture. The curve fitting suggests an apparent activation energy of 24.6 kcal/mol. The fitting is shown in Figure 3.
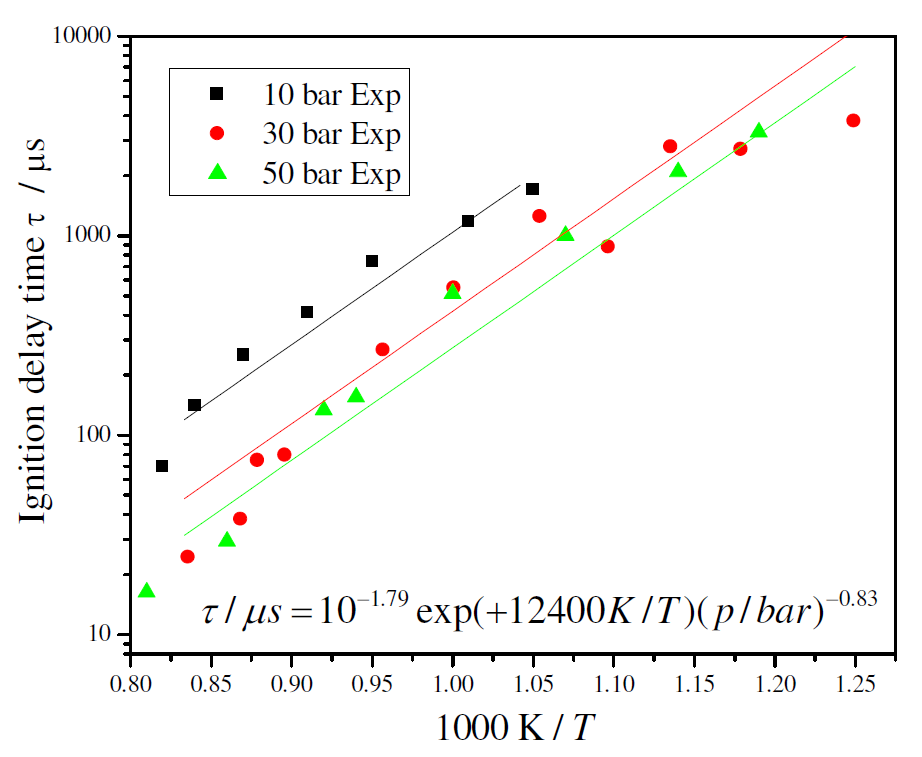
Figure 3. Experimental and curve fitted ignition delay times for stoichiometric ethanol/air mixture
The measurements exhibit a decrease in ignition delay time as the pressure increases. There is also a smaller sensitivity to pressure at higher pressures. The variation with temperature at higher temperature tends to become smaller but the data does not indicate the existence of a negative temperature coefficient (NTC) region. These results are next used as a basis to extend current detailed chemical kinetics models for ethanol oxidation.
4. Detailed chemical kinetics modeling
4.1. Model development
In the present work, the Konnov (2000) and Marinov (1999) detailed kinetic models were taken and tailored to build up the proposed model. Initially, the extensively tested kinetics model for small hydrocarbons of Konnov was extended to the combustion of ethanol by adding the reactions described by Marinov that were missing in Konnov’s mechanism. Then, in order to further improve the predictive capability of the model, a comprehensive review of the literature was performed and new kinetic data was found in Li et al. (2004), Lin et al. (2002), Lin et al. (2003) and Lin et al. (2004). They allowed for an update of the values of the reaction constants of several elementary reactions involving ethanol. Some elementary reactions that appeared neither in Konnov’s nor in Marinov’s mechanisms were also added. The adaptation process of the kinetic model was based on blending the different sub-mechanisms for ethanol and other sub-structures from Marinov, Li and Lin et al., that were not taken into account by Konnov, calculating ignition delay times with the subsequently formed mechanisms and comparing the results enerated by the modified and base mechanisms. In summary, the model allows the specific reactions for ethanol decomposition of Figure 4.
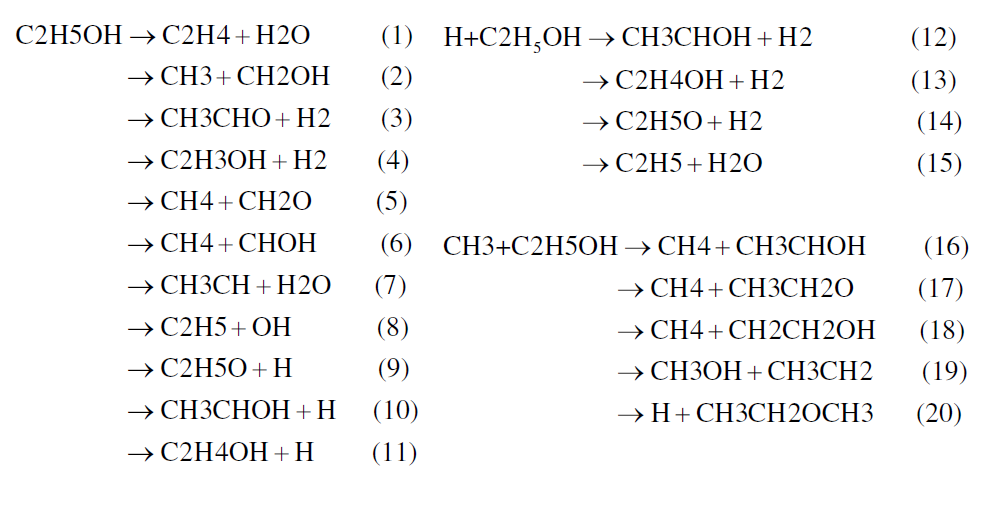
Figure 4. Specific reactions for ethanol decomposition
Lin et al. (2002) found that at pressures below 10 bar, the unimolecular decomposition of ethanol occurs primarily by the dehydration reaction producing C2H4 + H2O, represented by reaction (1). At high-pressure limit and over 1500 K the production of CH3 and CH2OH becomes dominant, represented by reaction (2). The H2-molecular elimination process, represented by reactions (3) and (4), is not important throughout the temperature range investigated (700 – 2500 K). Concerning the chain-propagation reactions by the H atom (reactions 12 to 15) the reaction of dehydration (15) has a high energy barrier and the possibility that the reaction (15) proceeds is very low. In this group of reactions, reaction (14) represents about 10% of the total reaction rate in the temperature range analyzed by Egolfopoulos et al. (1992). Reactions (12) and (13) remain, however, the most important. In the CH3-radical chain-propagation reactions, reactions (19) and (20) have higher energy barriers and their feasibility can be ruled out kinetically. The other reactions forming methane by H abstraction, reactions (16), (17) and (18), remain important and, at higher temperatures (T > ~1200 K), reaction (18) becomes dominant. These oxidation routes lead ultimately to the production of methane, formaldehyde and other oxygenated hydrocarbons, as depicted in Figure 1, whose kinetics are well treated in the Konnov mechanism. In the proposed detailed kinetic model the most important reactions for the ethanol oxidation were selected and placed, ruling out those reactions whose energy barriers limitations were noted by the different authors. The final proposed detailed kinetics model is composed by 136 chemical species and 1136 elementary reactions. Table 2 shows the major characteristics of the detailed kinetic mechanism used in this work.
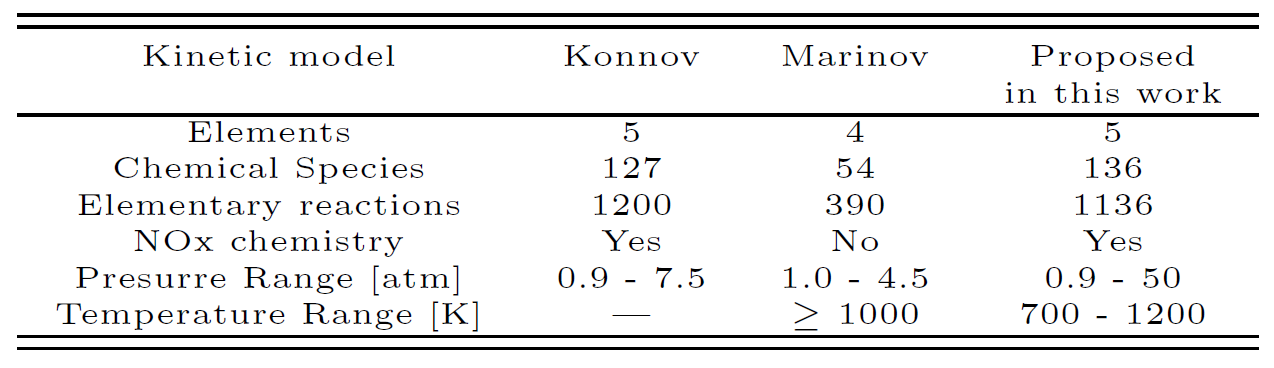
Table 2. Characteristics of the detailed kinetic models
The sensitivity analysis (discussed below) revealed that reaction C2H5OH + HO2 ⇄ SC2H5O + H2O2 has the largest sensitivity on temperature, OH, H2O2 and C2H5OH concentrations in the whole temperature interval tested. To impove the predictive capability of the kinetic model, the original Arrhenius parameters of this reaction in the Konnov mechanism were altered. The total reaction rate constant for this reaction in the proposed mechanism was formed by the sum of three constants: ka = 1.0118 exp(+41351 / RT), kb = 4.65129 T41.37 and kc = 2.4523 T4.97. A similar expression for this rate constant was not found in the literature and this is advanced here as a way of better predicting the measurements for higher pressure and lower temperature.
4.2. Results and comparison to measurements
Figure 5 shows the comparison between the measured and the predicted ignition delay times. The kinetic model is able to predict the general trends with temperature and pressure, including the smaller dependence with pressure for higher pressures and a smaller dependence with temperature for lower temperatures. At the pressure of 10 bar, the detailed kinetic model over predicts the ignition delay time for higher temperature.
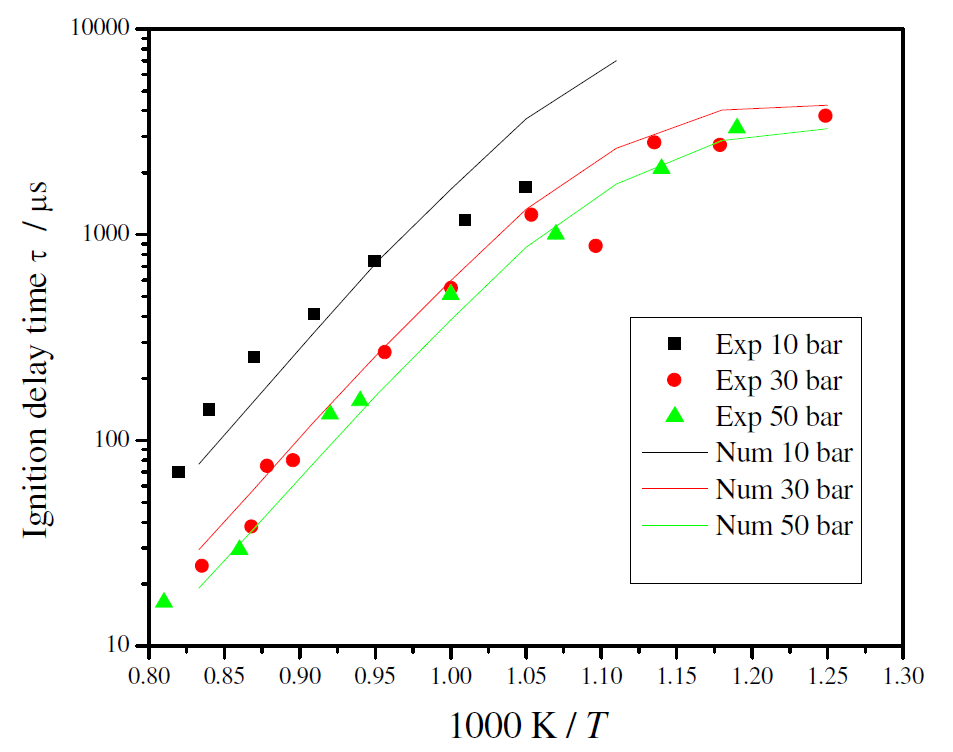
Figure 5. Comparison between predicted and measured ignition delay times for ethanol/air stoichiometric mixture
4.3. Sensitivity analysis
A first-order sensitivity analysis of the effect of each reaction on temperature, OH, H2O2, and C2H5OH concentrations was performed to find out which reactions dominate the ethanol oxidation at high pressures and also which reaction coefficients need to be systematically improved. For the analysis, we assumed that the combustion process occurs in a perfectly stirred reactor starting at time t = 0 s and ending at t =τing. The conditions of the reactor were set at stoichiometric composition, pressures of 10, 30, and 50 bar and temperatures of 1100, 950, and 800 K. The sensitivity map was generated from the output files from CHEMKIN and shows the more sensitive reactions for the entire kinetic evolution of the system.
The sensitivity map shows that reactions C2H5OH + HO2 ⇄ SC2H5O + H2O2 (R1), SC2H5O + O2 ⇄ CH3CHO + HO2 (R2), C2H5OH + OH ⇄ SC2H5O + H2O (R3) and HO2 + HO2 ⇄ H2O2 + O2 (R4) are the more sensitive reactions at high pressures (10, 30, and 50 bar) and for intermediate and high temperatures (800, 950, and 1100 K). It seems that at high pressures the main ethanol oxidation path is dominated by the H-atom abstraction by the hydroperoxy radical (HO2), producing CH3CHOH (named SC2H5O in this work), one of the three isomers of C2H5O.
This route corresponds to reaction R1 above and is represented schematically in the top part of Figure 6. This path leads to the hydrogen peroxide sub-mechanism. In the bottom part of Figure 6, is represented the Hs-abstraction path by collision with a third-body M. This path results also in the production of CH3CHOH which is then oxidized forming acetaldehyde, leading to the acetaldehyde sub-mechanism, and HO2.
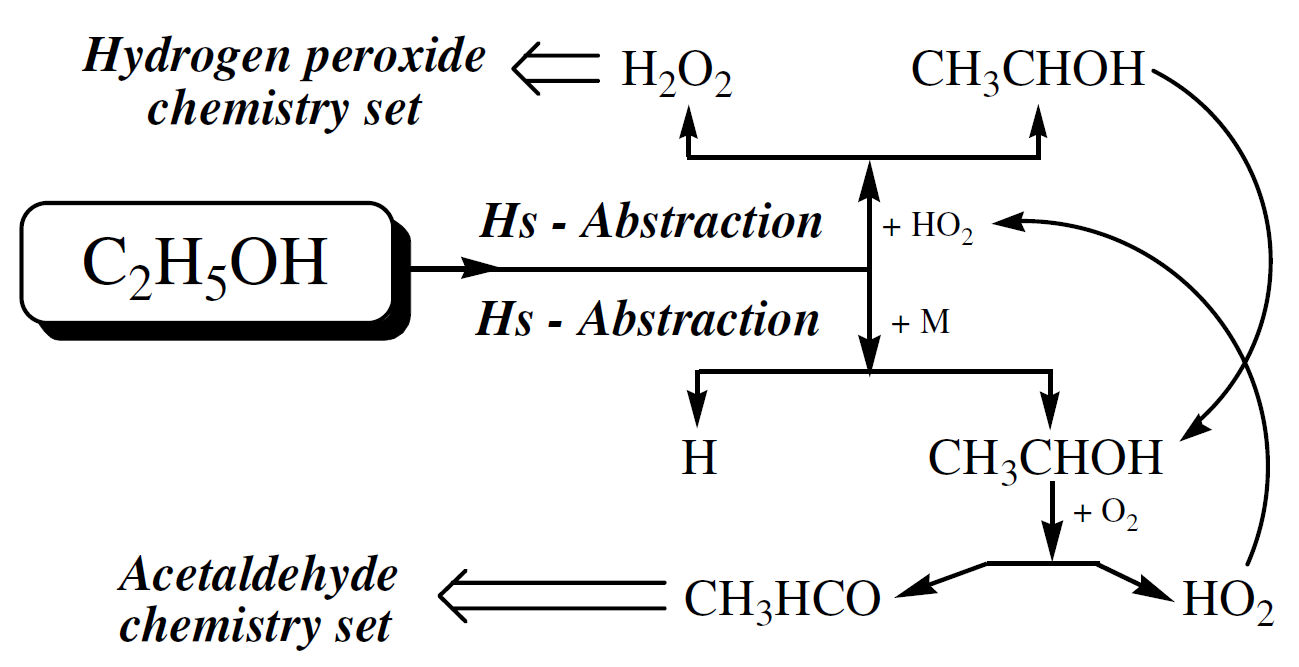
Figure 6. Main ethanol oxidation route at high pressure
This corresponds to reaction R2 above. The hydroperoxy radical (HO2) feeds reaction R1 giving more SC2H5O, forming a cycle for the production of SC2H5O and HO2 and depletion of ethanol. R3 becomes relevant when the pool of HO2 is formed. The reaction proceeds and more SC2H5O are produced. With the increase of HO2 concentration, reaction R4 becomes important.
5. Conclusions
In this paper we proposed a detailed kinetic model for the thermal oxidation of ethanol/air mixtures at higher pressures and intermediate and high temperatures. The model results from a combination and tailoring of the Konnov (2000) and Marinov (1999) models. Initially, the extensively tested kinetic model for small hydrocarbons of Konnov (suitable for hydrocarbons with up to 3 carbon atoms) was extended to include the combustion of ethanol by adding the reactions described by Marinov. Then, in order to further improve the predictive capability of the model, a comprehensive review of the literature was performed and new kinetic data was added from Li et al. (2004), Lin et al. (2002), Lin et al. (2003) and Lin et al. (2004). There data enabled us to update the values of the reaction rate constants of several elementary reactions involving ethanol. Some elementary reactions that appeared neither in Konnov’s nor in Marinov’s mechanisms were also added.
A first-order sensitivity analysis revealed that reaction C2H5OH + HO2 ⇄ SC2H5O + H2O2 had the largest sensitivity on temperature, OH, H2O2 and C2H5OH concentrations in the whole temperature interval tested. Then, the rate constants for this reaction were modified in order to better predict the measurements for higher pressure and lower temperatures. The final mechanism is composed of 136 chemical species and contains 1136 elementary reactions. The model was then validated against experimental data of ignition delay time from shock-tube measurements in the pressure range of 10 ≤ p ≤ 50 bar and temperature range of 750 ≤ T ≤ 1200 K. The detailed kinetics model predicts the reduced pressure sensitivity of the ignition delay time at higher pressures. Additionally, it predicts the global trend with temperature. No negative temperature coeffcient region was detected in the temperature and pressure range analyzed. From the detailed kinetic modeling, a possible main oxidation route for ethanol oxidation at high pressures is suggested. This route involves the H-atom abstraction from the secondary carbon of the ethanol molecule by reaction with hydroperoxy radical, giving CH3CHOH and H2O2 as major products. It is recommended a more complete comparison of predictions with this reaction mechanism against previous measurements and also a more thorough study of the reactions pointed as the most sensitive, especialy the reaction C2H5OH + HO2 ⇄ SC2H5O + H2O2.
Acknowledgements
The authors gratefully acknowledge the CNPq – Brazil, DAAD and DGF – Germany, for the support given in the development of this work. The help of N. Schlösser in conducting the experiments is also greatly appreciated.
References
- Barnard J.A. and Hughes H.W.D. (1960), The pyrolysis of Ethanol, Trans Faraday Soc,56,p55.
- Borizov A.A., Zamanskii V., Konnov A.A.,Lisyanskii V., Rusanov S., Skachkov G., (1989), Sov. J Chem. Phys., Vol 4(11), pp.2561
- Borizov A.A., Zamanskii V. ,Konnov A.A. ,Lisyanskii V. ,Rusanov S., Skachkov G., (1991), Sov. J Chem. Phys., Vol 8(1),pp.121
- Borizov A.A., Zamanskii V., Konnov A.A., Lisyanskii V., Rusanov S., Skachkov G., (1992), Sov. J Chem. Phys.,Vol 9(11), pp.2527
- Cancino L.R., Oliveira A.A.M. (2006), Proc. of the 11th ENCIT 2006. ABCM, Brazil.
- Cancino L.R., Fikri M, Oliveira A.A.M., Schulz C. (2007), Eastern State Fall Technical Meeting. U. of Virginia. October 21-25.
- Curran H., Dunphy M., Simmie J., Westbrook C., Pitz W. (1992), Twenty-Fourth Symposium (International) on Combustion, pp.769
- Dunphy M.P., Simmie J.M. (1991), J. Chem. Soc. Faraday Trans., 87(11), 1691-1696.
- Egolfopoulos, F.N., Du, D.X., Law, C.K. (1992), 24th Symposium (Int.) on Combustion, pp.833
- Gardiner W.C. (2000), Gas Combustion Chemistry, Springer-Verlag – USA.
- Gulder Ä O. (1982), Nineteenth Symposium (Internatinal) on Combustion, pp. 275.
- Kee R.J., et al, (2000). CHEMKIN Collection, Release 3.7.1 R&D, Inc., San Diego, CA.
- Konnov. A.A (2000), 28-th Symp. (Int.) on Comb., Edinburgh, Abstr. Symp. Pap. p.317.
- Kohse-Höinghaus K., T.S. Kasper, P. Oβwald, M. Kamphus. (2007), C&F 150 p.220.
- Li J., Kazakov A., Dryer F.L.J., (2004), Phys. Chem. A. (Article),108(38) 7671-7680.
- Li J., Kazakov A., Chaos M., Dryer F.L. (2007), 5th US Comb. Meeting, San Diego, March 25-28 Paper C26.
- Lin M.C., Park J., and Zhu R.S. (2002), Journal of Chemical Physics. Vol 117, Number 7
- Lin M.C.,Park J., and Xu Z.F. (2003), Journal of Chemical Physics. Vol 118, Number 22
- Lin M.C., Xu Z.F. and Park J. (2004), Journal of Chemical Physics. Vol 120, Number 14
- Marinov. N.M. (1999), Int. J Chem. Kinet. 31. p.183
- Natarajan K. and Bhaskaram K.A. (1981), Proc 13th Int. Shock tube Sym. Niagara Falls,pp.834.
- Oertel H. (1966), Stoβrohre, Springer-Verlag,Wien/New York.
- Palmer H.B., Knox B.E. (1961), ARS J. 31 826-828.
- Saxena P., Williams F.A. (2007), Proc. Comb. Ins. 31 p.1149.
Note: This work was published in the 27th International Symposium on Shock Waves – 19..24 July-2009, St. Petersburg
.
.

……………….
Measurement and chemical kinetics modeling of shock-induced ignition of ethanol-air mixtures